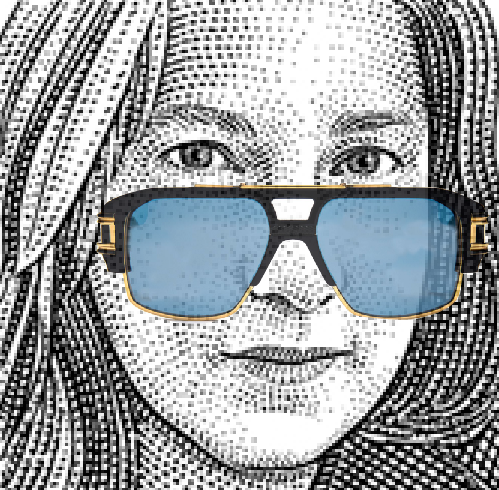
When people ask me what I do, I never quite know how to explain it. My practice is a strange mix of left-brain/right-brain storytelling. I work with data, from numbers to pictures to words, to make stories and show the news. I'm agnostic about platforms and story forms. I’m published on the interwebs, in books, and if you saved newsprint, there too.
My first gig was as a graphics editor for The New York Times. I was trained to report the story from the ground up, translate it visually and produce it on deadline. This is the foundation for everything I do.
I was at The Times for 15 years before I went to Fortune to take the infographics director job. There, I ran a team, worked with CNNMoney, and learned to make shiny magazines. Following Fortune, I was a Visual Editor at The Wall Street Journal on the Biz & Tech section and the Money & Investing section and with special reports. After the Journal, I joined Quartz as editor of the Things team. These days you can find me at Reuters graphics, making stories with data.
Over the course of my career, I've worked on everything from infographics that span two pages of newsprint to long-form multimedia stories to deep data dives to designing front-ends, and tools, from breaking news to news products.
I also teach Visualizing Data at The New School’s Journalism + Design program. My students wake me up and show me new paths.
The short version is, I love what I do. It's different every day and I never stop learning. I feel super lucky and I feel strongly about paying that forward. Please do reach out to me if you'd like to chat data or data viz or news or visual storytelling.
And by the way, thanks for coming to my website. If you like it I hope you'll share it. :)
-s

