Have you noticed that infographics are everywhere? You can't swing a diagram of a cat without hitting an infographic about making an infographic. As someone who loves data viz to death (I do it for a living) I've been stewing about the meaning of this trend. A lot.
Let’s talk about the future of infographics.
Back in the day, I spent a lot of time finagling my way into New York City nightclubs. Me and my pal Gigi-the-Great (yes, this is going somewhere) would find the place to party, meet and greet the doormen so we could cut the line and dance like maniacs while the rest of the city slept. We repeated this for weeks, as many times as possible, until the club went “bridge and tunnel,” meaning it went from a fresh space to play to a place packed with people stampeding into Manhattan via random infrastructure.

No, this ID didn’t get me access to anywhere except the dining hall, but my last post for MIX Online started with IDs, so it’s a theme.
The demise of The Limelight was my first experience with a lifecycle: egg, larva, caterpillar, chrysalis, butterfly, dead thing, dust, do-over—first grade science in real-life.
Wait, this has what to do the future?
Where we are now is an indicator of where we’re headed, no?. Nightclubs, bugs, infographics, the box of cream cheese in the back of your refrigerator, the television, the telephone, the back-left rear tire on your Prius… everything has a unique rise and fall. Some things stick around for a very long time, like my husband’s favorite pair of Doc Martens. Other things become obsolete very quickly.

So where is the infographics industry right now? I’d say somewhere around caterpillar.
Caterpillar? Even though charting is super popular? Yes, caterpillar. We’ve got an interweb that is 10 years old and we’re churning out lots of Big Data. Big Data always makes me think of an evangelical preacher greeting his flock.

If you add the cloud (Big Data in the sky?) and a generation of folks who crave niche news, sprinkle on some Edward Tufte dust, Hans Rosling’s Gapminder, a pinch of David McCandless’s Ted talk… and voilà: maps and bubble charts, decision trees and streamgraphs, sankey diagrams and sparklines flogged across so many blogs. Would anyone mind curating so I can keep up?
Of course, there are haters out there who say this flowering of chartage is simply junk food for the beast of our constantly interconnected brains. I very much object to the idea that smart information design dumbs things down. And the term “charticle” makes me want to kneecap someone, but that’s another rant entirely.

The tricky part about this high-speed train is not velocity or volume; it’s that we’re riding on an untraveled track in the yawning gap between old and new media. Neither side has figured out properly what to do with all these ones and zeros because a) we have different expectations about how our information should arrive based on b) how we’ve spent our lives consuming it and c) the value that we place on it.
Think of it this way:
Old Media registered for electives junior year on paper with pencil. They love Facebook, because they can organize Camp Ramah reunions with it, but fear Twitter might replace Twain. At work, they know they’re sitting on a gold mine of data, but those metrics won’t sit up, beg, or roll over for them, because all they know how to do is torture the numbers.

(I love this video. I could watch it twice a day.)
However, Old Media is savvy enough to know that if they set up an API and issue a Visualization Challenge!, someone will get the job done.
New Media, on the other hand, is a little buzzed from the extra latte they purchased to get a mayor’s badge and sort of distracted, because the Wi-Fi keeps cutting out. They’re learning the hard way, since they didn’t bother with privacy settings, that their breadcrumb trail will always haunt them. Living fully open on the internet is a little like nicotine; my parent’s generation smoked a lot. Later that turned out not be a great idea.
I’m not referring to fiascos like the Anthony Weiner underpants tweet or this secret service gem:
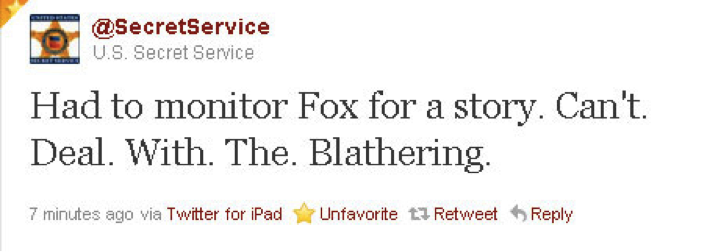
I’m referring to the fact that every time we ping a server, we leave a data trail the totality of which comprises our digital body. And it has a formidable half-life. One of the fastest growing businesses on the internet is the collection of user profiles culled from hundreds of cookies on your computer for uses like targeted advertising.
Data, data collection, data analysis, who owns our data, how it’s disseminated, how it’s stored, monetized, and shared—are all rising commodities. The deluge explains the popularity of infographics. It also explains memes like Wikileaks and incidents like the Nintendo network hacking. Meanwhile, scientists who’ve always adored empirical evidence are snickering into their soufflés.
The information age is truly overwhelming and most of us are too lost in the links to be conscious of our digital wake. How much do you know about what happens to your information? Did you know that you net over 200 tracker files for one visit to Dictionary.com?
With all these measurements running around naked, willy-nilly it’s telling that Facebook hired Nicholas Felton of Feltron Report fame. How perfect. The future of infographics will arrive when this part of our fifth grade math test involves deciphering fitbit data.

I know, you’re thinking that everything moves at the speed of light these days, Roger Moore’s law or whatever it is. You want to know if we’ll also get barcodes tattooed on the back of our necks and GPS chips embedded in our butts? Um, no not really. The pace of the digital revolution will be tempered by human behavior and the limits of our adaptability.
We have a ways to go. Consider that outside of Silicon Valley “web people” are still ancillary parts of the workforce. Sure, there’s a lot of discussion about the best way to integrate operations staffs. Should we redesign the site? Do we need to think about social media? Meanwhile, in backwards-looking companies, designers and developers are among the first to be made redundant during layoffs, like vestigial appendages.
In the future, we will be thumbs.
Spend a lifetime in a news stream delivered in a visceral form and going in reverse is not an option. People and companies are getting wise to the value of the data stream, education is shifting to accommodate new technology and tools, and bright lines are forming between those on the side of open source versus those building high-walled gardens. When more millennials are in charge of staffing, information graphics will become commonplace. The revolution will be visualized.
So the future, here’s how I see the lifecycle:
2020: Infographics ↔ Dogturtle

My kid is in high school and she’ll have a set of tools that track and chart her screen usage, homework output and texting patterns, which will come in super handy as a parent, aka so I’d pay for that. She’ll understand the difference between “most popular” and “‘most meaningful” and the importance of locking down her personal data (especially from her mother) so her web trail will be a perfectly crafted reflection of a visual polymath that any respectable engineering school outside of San Francisco would love to have.
Her dad? He’ll still be wearing the same Docs. Her mom? She’ll be working for a media company that is a mashup of The Guardian, Twitter, Instagram, The Sunlight Foundation, and Stamen as the Director of Visualization, guiding a team of young Visualists who enlighten the world with socially interconnected information graphics.
I don’t know why, but I see myself as halfway between Milo and Chroma in“The Phantom Tollbooth” conducting an orchestra that plays the colors of the sunrise. (Please treat yourself this book if you never read it as a kid.)
2030
By the 30s, information graphics will insinuate themselves into academia so our Feltron babies will have the bright light of data viz to illuminate their path. You can earn an advanced degree in Visualization (the Google Koblin fellowship is still just a seed of an idea) and if you’re lucky enough, earn credits in Science and Storytelling virtually co-taught by Ben Fry and Amanda Cox. For sports teams, the most popular day at the stadium will not be events like the playoffs, but free Chartball poster day!

Unfortunately, a rash of hackers and a cascading series of power failures will shut down the Internet worldwide for 37 hours. In response, new communities will form around old-school objects like the awl, the unicycle, and Parcheesi.
2040: Infographics ↔ Dogasaur

Every room in every home will have a networked digital calendar/to-do list (plus an awl, a unicycle, and Parcheesi). The calendar will sync [cloudify] everyone’s email and surface the whereabouts of our friends, acquaintances, and frenemies. We’ll check it just before we sleep and first thing in the morning—much like we used to do with that awkward equipment stack of smart phones, tablets, and laptops—browsing the personalized screen that visualizes our dietary preferences, cross-referenced with our doctor’s nutritional recommendations, filtered by favorite meals, linked to our smart fridge/grocery list, based on a compilation of monthly food intake, which is available as a feed back for our medical records assuming you buy the premium version. It will of course be displayed as a brilliant series of information graphics, paid for courtesy of our share of the class-action settlement in the ‘Social Media 3’ case.
(Meanwhile just for fun, if you think of yourself as New Media, add 30 years to your age. If you’re Old Media… don’t go there.)
2050
The family historian will use the family tree researched by his antecedents to diagram patterns in his dna that help him to make decisions about the appropriate amount of time for someone with his genetic makeup to spend off the grid. It will also be a stunning piece of wall art.
Meanwhile, his younger sister will browse an interactive map of the best places to travel based on where she’s likely to find a mix of like and unlike-minded people, filtered by cities to avoid because of population density and what she can afford if the buyer comes through for her microblog/guide to carbon upcycling.
Also, wealth will be more equally distributed and certain diseases eradicated as low-cost cloud-based computing blankets the planet.
2060: Infographics ↔ Dogerfly?

Seriously? I have no idea.
I'm not sure what will be around in 50 years, but information graphics will. We’ve been making pictures to understand our existence since Messrs. Windsor & Newton’s ancestors were scratching horsies on their cave walls. Lifecycle-wise, the form and function of visual storytelling is not turning to dust any time soon. If anything, it’s found a new flame in the data deluge. So no speculation from me on charting in the 22nd century. After all, there’s an old saying that goes: He who lives by the crystal ball ends up eating glass.
(Ok, let me explain, back in the day, glass was an amorphous (non-crystalline) solid material…)